


21 Stocks Could Have A Positive Earnings Surprise and 6 That Could Have A Negative Earnings Surprise
Making predictions on earnings releases for learning and fun.

How cool would it be able to tell if a stock will have a positive or negative earnings surprise?
If you can make good money with 55% accuracy, what about 60 or 70% accuracy?
In this post, I look for clues that could signal a price move after earnings. I have no inside information or know what these stocks will do after earnings. But learning from these setups can help predict future earnings releases.
Of all the stocks that have reported earnings releases, I’ve called 11 out of 13 positive earnings surprises so far.
These are not recommendations. This post is meant for educational purposes only.
This is a free preview. If my predictions prove useful, I will make it a regular premium benefit.
Please consider a premium membership if you want options trade ideas. I share cash-secured puts, iron condors, and LEAPS trade ideas. I also share my infinite return portfolio updates that include quality dividend stocks.
Stocks That Could Have A Positive Earnings Suprise
In this section, I make educated guesses based on subtle clues that could indicate a bullish earnings surprise.
Possible Bullish Earnings Surprises
I don’t have time to evaluate each stock, but they all have clues of a bearish earnings surprise.
TMUS 0.00%↑ (result: positive earnings surprise)
BTU 0.00%↑ (result: negative earnings surprise)
XOM 0.00%↑ (result: positive earnings surprise)
NEM 0.00%↑ (result: positive earnings surprise)
AMD 0.00%↑ (result: positive earnings surprise)
AMZN 0.00%↑ (result: positive earnings surprise)
HD 0.00%↑ (result: positive earnings surprise)
PEP 0.00%↑ (result: positive earnings surprise)
ASML 0.00%↑ (added 1-23-2025) Result: positive earnings surprise, up 4.29% in one day)
TXN 0.00%↑ (added 1-23-2025 before the earnings release) Result: Positive earnings surprise, down 7.52% in one day)
BA 0.00%↑ (added 1-26-2025 2 days before the earnings release) (Earnings disappointed) However, the stock was up 1.48% in one day.
ABBV 0.00%↑ (added 1-29-2025 2 days before the earnings release) Result: positive earnings surprise.
AAPL 0.00%↑ (added 1-30-2025 before earnings release) Result: Positive earnings surprise
DE 0.00%↑ (added 2-4-2025 9 days before earnings release) Result: positive earnings surprise)
RKLB 0.00%↑ (added 2-14-2025, 4 days before the earnings release) (result: negative earnings surprise)
AAOI 0.00%↑ added 2-14-2025, 12 days before the earnings release) (result: negative earnings surprise)
TKO 0.00%↑ added 2-17-2025, 9 days before the earnings release) (result: positive earnings surprise)
FL 0.00%↑ added 2-20-2025, 13 days before earnings release) (result: positive earnings surprise)
TDW 0.00%↑ added 2-21-2025, 6 days before earnings (result: negative earnings surprise)
TEM 0.00%↑ added 2-22-2025, 2 days before earnings (result: negative earnings surprise)
I removed FSLR on 2-10-2025, 15 days before the earnings release)
TMUS
Tmobile US, Inc. TMUS 0.00%↑
Closing Price: $218.97
Earnings release date: 1-29-2025
RSI Trendline: Upside breakout (very bullish)
Distance from moving average trendline: Upside breakout (very bullish)
MACD: Making higher highs (bullish)
Volume Trendline: Upside breakout (very bullish)
Volume Profile: TMUS is near the point of control. At this price level, candle sizes are relatively small. If TMUS can break through, candle sizes are larger from the $220 to $230 price range. From $200 to $210 is also a larger candle stick zone. These are price acceleration zones where volume is lower.
Overbought/Oversold: RSI is 47 and TMUS is closer to the bottom of the Bollinger band range.
Chart Pattern: None.
Order block: A bullish order block is detected below the current price.
Candlestick: TMUS had a doji to close the week, closing near the high of the week.
Support: $209.83
Resistance: $220
Risk-reward: 9 to 1, risking 9 to make 1.
Skin in the game (full disclosure): I own TMUS shares.
Result: Positive earnings surprise.

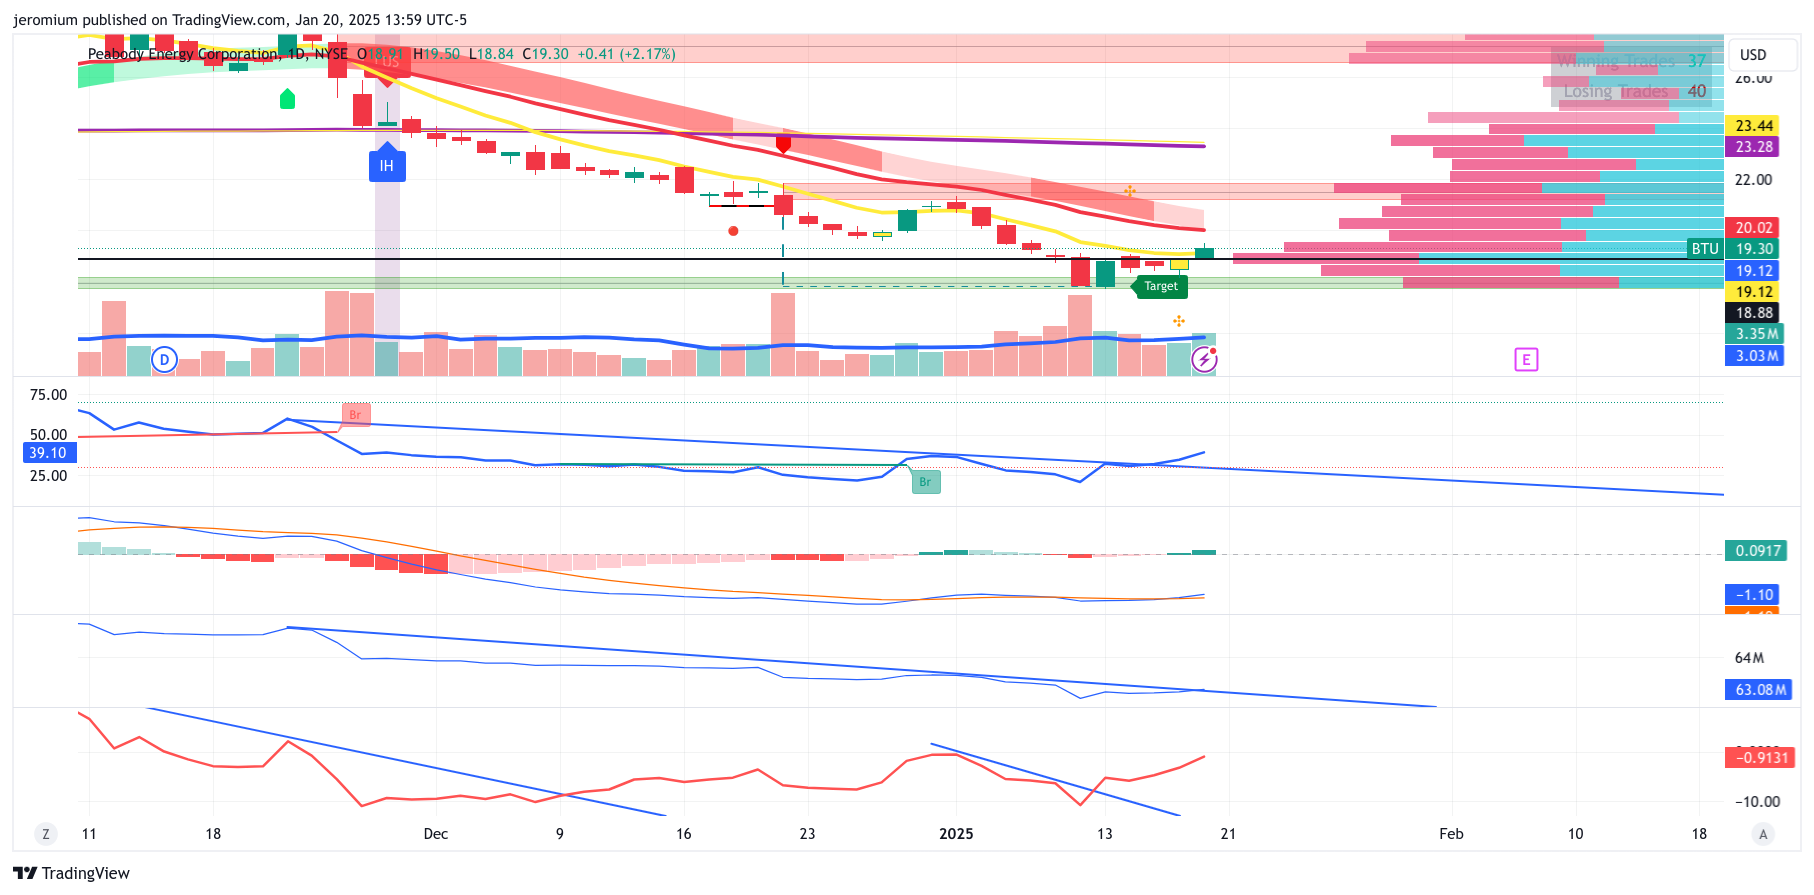
BTU
Peabody Energy Corporation BTU 0.00%↑ Closing Price: $19.30
Earnings release date: 2-6-2025
RSI Trendline: Upside breakout (very bullish)
Distance from moving average trendline: Upside breakout (very bullish)
MACD: Making higher highs (bullish)
Volume Trendline: Upside breakout (very bullish)
Volume Profile: BTU is just above the point of control. At this price level, candle sizes are relatively small. If BTU can break through, candle sizes are larger from the $20 to $24 price range. From $19 to $18 is also a larger candle stick zone. These are price acceleration zones where volume is lower.
Overbought/Oversold: RSI is 39 and BTU is closer to the bottom of the Bollinger band range.
Chart Pattern: None.
Order block: A bullish order block is detected below the current price.
Candlestick: BTU had a medium-sized green candle, closing near the high of the week.
Support: $17.73
Resistance: $22
Risk-reward: 1 to 1, risking 1 to make 1.
Skin in the game (full disclosure): I own BTU call options and shares.
XOM
Exxon Mobil Corporation XOM 0.00%↑ Closing Price: $112.32
Earnings release date: 1-31-2025
RSI Trendline: Upside breakout (very bullish)
Distance from moving average trendline: Upside breakout (very bullish)
MACD: Making higher highs (bullish)
Volume Trendline: Upside breakout (very bullish)
Volume Profile: XOM is in an acceleration zone between $105 and $120. This means XOM could move significantly after earnings because of relatively low volume in this range.
Overbought/Oversold: RSI is 60 and XOM is near the top of the Bollinger band range.
Chart Pattern: None.
Order block: Bullish order blocks are detected below the current price.
Candlestick: XOM had a medium-sized green candle, closing near the high of the week.
Support: $105.78
Resistance: $116
Risk-reward: 1 to 1, risking 1 to make 1.
Skin in the game (full disclosure): I own XOM call options and shares.

These Stocks Could Have A Negative Earnings Surprise
In this section, I make educated guesses based on subtle clues that could indicate a bearish earnings surprise.
Possible Bearish Earnings Surprise Candidates:
UBER 0.00%↑ (result: positive earnings surprise)
DIS 0.00%↑ (result: positive earnings surprise)
MCD 0.00%↑ (result: negative earnings surprise)
CELH 0.00%↑ (added to the list 1-20-2025)
LVS 0.00%↑ (added 1-23-2025 before earnings release) Result: earnings had a negative surprise.
I don’t have time to evaluate each stock, but they all have clues of a bearish earnings surprise.
(I removed META from the list on 1-22-2025, 7 days before earnings release)
(I removed WMT from the list on 1-24-2025, 27 days before the earnings release)
(I removed COST from the list on 2-4-2025, 30 days before the earnings release)
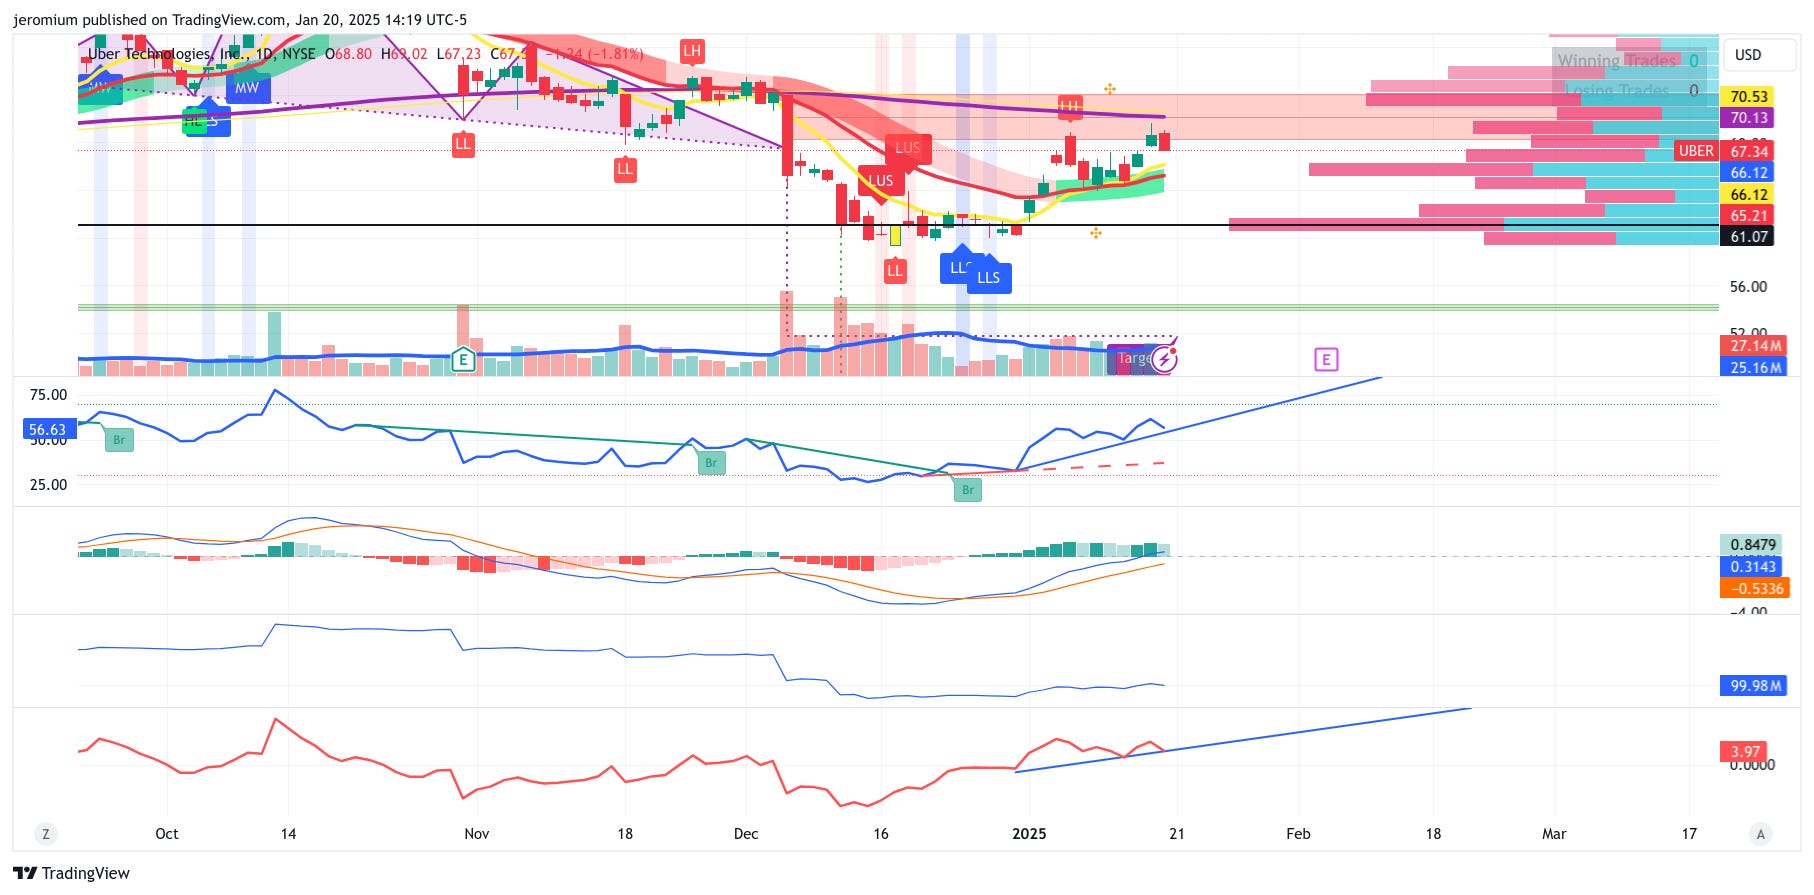
UBER Daily Chart
UBER Technologies, Inc. UBER 0.00%↑ Closing Price: $67.34
Earnings release date: 2-5-2025
RSI Trendline: Holding at the trendline (a breakdown would be bearish)
Distance from moving average trendline: Holding at the trendline (a breakdown would be bearish)
MACD: Making lower highs (slightly bearish)
Volume Trendline: Holding at the trendline (a breakdown would be bearish)
Volume Profile: UBER failed at $69.58, which is near a high volume price level.
BTU is just above the point of control. UBER is in the acceleration price range between $61 and $71. In this range, candlestick body sizes are large. This means UBER could fall significantly if it has a negative earnings surprise.
Overbought/Oversold: RSI is 56 and UBER bounced off the top of the top of the Bollinger band range.
Chart Pattern: UBER recently rallied after breaking down from a head and shoulders pattern. UBER is pausing at the low of the head and shoulders pattern, which could indicate further declines.
Order block: A bearish order block is detected above the current price.
Candlestick: UBER had a medium-sized red candle, closing below the recent low of the previous day.
Support: $63.96
Resistance: $70
Risk-reward: 1 to 2, risking 2 to make 1.
Skin in the game (full disclosure): None
Check Back Soon
Which stocks do you think will have a bullish or bearish earnings surprise?
P.S. For a limited time, you can get lifetime access for $199. You will get daily trade ideas when I find good setups and more premium strategies.
Disclaimer
This is meant for educational purposes only. It’s not financial advice. Please do your own due diligence. I’m not a financial advisor and can’t give you financial advice.
Trading is risky. Even if you know what you’re doing, you can still lose money. My returns are not typical, and there is no guarantee that you will be able to replicate them.
CFTC RULE 4.41 - Hypothetical or simulated performance results have certain limitations. Unlike an actual performance record, simulated results do not represent actual trading. Also, since the trades have not been executed, the results may have under-or-over compensated for the impact, if any, of certain market factors, such as lack of liquidity. Simulated trading programs in general are also subject to the fact that they are designed with the benefit of hindsight. No representation is being made that any account will or is likely to achieve profit or losses similar to those shown.
Read the full disclaimer here.