

7 Stocks About To Take Off On the Weekly and Daily Charts
Of the most actively traded stocks, these offer the best entry


Every week, I check the weekly charts of the most actively traded stocks. Then, I confirm on the daily chart. I consider reversal signals, chart patterns, and risk-reward.
I only found 7 stocks that appear ready to rally.
Week 1 picks outperformed SPY by 1.2%. These picks are free for now. But I will eventually reserve them for paid subscribers.
These are not recommendations. This post is meant for educational purposes only.
Please consider a premium membership if you want options trade ideas. I share cash-secured puts, iron condors, and LEAPS trade ideas. I also share my infinite return portfolio updates that include quality dividend stocks.
One Week Returns
SPY: -.51%
AMAT: +1.94%
AMD: +.14%
AMGN: -.54%
BABA: +.56%
XOM: +1.30%
NEM: +0.71%
Picks for the week ROI: 0.69%
Relative to SPY: 1.2%
Seven Stocks Ready To Take Off
Of all the actively traded stocks, these are the best to consider right now for bullish trades or more importantly, learning how to recognize good opportunities.
Stocks are listed in alphabetical order.
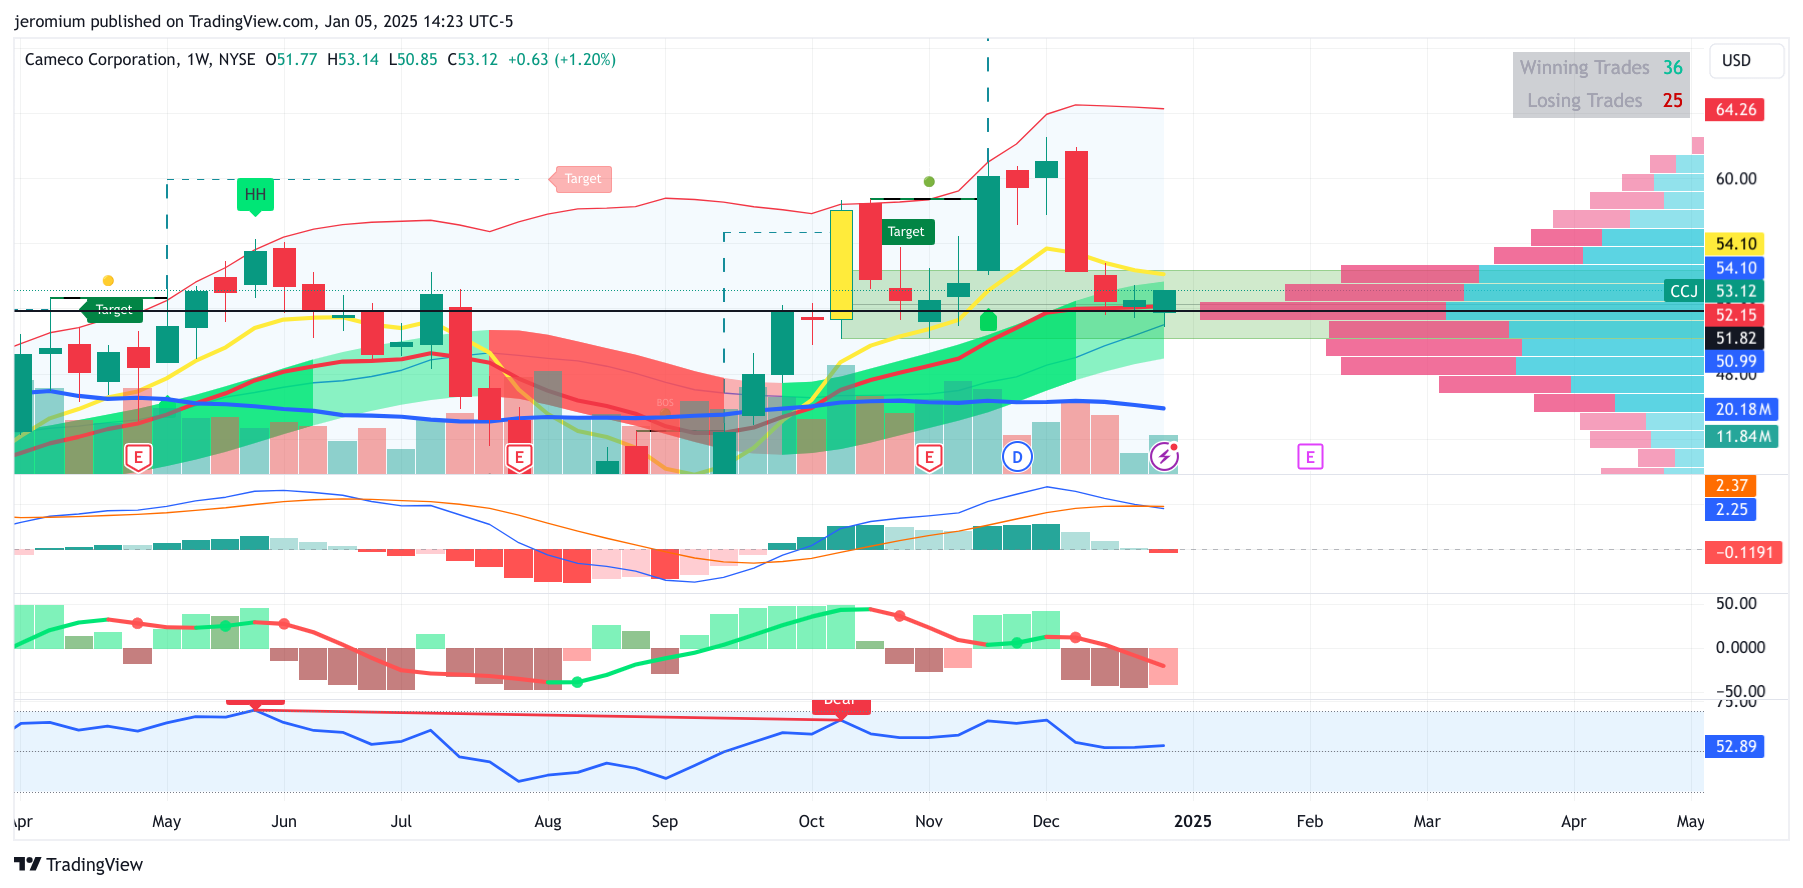
CCJ Weekly Chart
Cameco Corporation $CCJ
Closing Price: $53.12
Momentum: Momentum is slowly increasing. Although the B-Xtrender is making higher lows, the MACD is still making lower lows. RSI is slowly increasing..
Overbought/Oversold: CCJ is neutral, RSI is 52, and CCJ is near the bottom of the Bollinger bands. This rally has room to run.
Chart Pattern: None.
Volume: Volume is not higher on the rally than the decline yet.
Candlestick: A relatively long green candle closer at the high of the week.
Support: $51
Resistance: $61
Risk-reward: 4 to 1, risking 1 to make 4.
Skin in the game (full disclosure): I have a bullish CCJ trades and shares.
CCJ Daily Chart
Closing Price: $53.12
Momentum: Momentum is turning positive as the B-Xtrender is making higher highs and the MACD is making higher lows and is close to crossing over. RSI is increasing quickly.
Overbought/Oversold: CCJ is neutral, RSI is 45, and CCJ is in the lower range of the Bollinger bands. This rally has room to run.
Chart Pattern: None.
Volume: Volume is not higher on the rally than the decline yet.
Candlestick: CCJ gapped up on Friday and formed a relatively long lower wick. However, CCJ had a small green candle closing at the day’s high.
Support: $51
Resistance: $56
Risk-reward: 3 to 2, risking 2 to make 3.
My Plan: I will look for another trade opportunity or close my bullish trade if it reaches resistance and the momentum slows.

CELH Weekly Chart
Celsius Holdings CELH 0.00%↑:
Closing Price: $28.80
Momentum: Turned positive and is making higher highs on the MACD, B-Xtrender, and RSI.
Overbought/Oversold: CELH is still oversold, RSI is 38, and CELH is also in the middle of the Bollinger bands. This rally has room to run.
Chart Pattern: CELH is forming a double-bottom pattern which could potentially take it to about $39.
Volume: Not higher on the rally than the decline yet.
Candlestick: A bullish engulfing candle.
Support: $25
Resistance: $33
Risk-reward: 1 to 1, risking 1 to make 1.
Skin in the game (full disclosure): I have an open bullish CELH trade, a bullish skewed iron condor that gives me time to be right.

CELH Daily Chart
Closing Price: $28.80
Momentum: Turned positive and is making higher highs on the B-Xtrender, and RSI, and higher lows on the MACD.
Overbought/Oversold: CELH is still oversold, RSI is 52, but CELH is above the upper Bollinger band. This could mean a pause or a brief pullback before moving higher.
Chart Pattern: CELH is forming a double-bottom pattern which could potentially take it to about $39.
Volume: Volume is slightly below average on this rally.
Candlestick: A long bullish candle, closing near the high.
Support: $25.60
Resistance: $33
Risk-reward: 4 to 3, risking 3 to make 4.
My plan: If I didn’t own any, I’d wait for a pullback and a bounce on the daily chart.

MRNA Weekly Chart
Moderna, Inc. MRNA 0.00%↑
Closing Price: $42.18
Momentum: Turned positive and is making higher highs on the MACD, B-Xtrender, and RSI.
Overbought/Oversold: MRNA is still oversold, RSI is 31, and is also near the bottom of the Bollinger bands. This rally has room to run.
Chart Pattern: MRNA is near the bottom trendline of a bullish falling wedge.
Volume: Not higher on the rally than the decline yet.
Candlestick: A small green candle, closing near the high of the week.
Support: $35.80
Resistance: $60
Risk-reward: 3 to 1, risking 1 to make 3.
Skin in the game (full disclosure): I don’t have a position.

MRNA Daily Chart
Closing Price: $42.18
Momentum: momentum is positive and is making higher highs on the MACD, B-Xtrender, and RSI.
Overbought/Oversold: MRNA is still oversold, RSI is 50, and is in the middle of the Bollinger bands. This rally has room to run.
Chart Pattern: None.
Volume: Not higher on the rally than the decline yet.
Candlestick: MRNA closed the week with a doji on Friday, the day before it had a small red candle with a long upper wick. These candles indicate indecision and MRNA could pause its rally or pull back to support before moving higher.
Support: $38.20
Resistance: $43
Risk-reward: 1 to 4, risking 4 to make 1.
My Plan: I will consider a bullish position next week if I find a good entry.

NEM Weekly Chart
Newmont Corporation, NEM 0.00%↑
Closing Price: $38.11
Momentum: Turned positive and is making higher highs on B-Xtrender and higher lows on the MACD.
Overbought/Oversold: NEM is still oversold, RSI is 36 and is also near the bottom of the Bollinger bands. This rally has room to run.
Chart Pattern: NEM is near the bottom of the right shoulder of an inverted head and shoulders pattern.
Volume: Not higher on the rally than the decline yet.
Candlestick: A bullish engulfing candle, closing closer to the high of the week than the low of the week.
Support: $37
Resistance: $41
Risk-reward: 3 to 1, risking 1 to make 3.
Skin in the game (full disclosure): I have a bullish NEM options trade and shares.

NEM Daily Chart
Closing Price: $38.11
Momentum: Momentum is positive and is making higher highs on B-Xtrender, the MACD, and the RSI.
Overbought/Oversold: NEM is still oversold, RSI is 38, and is also near the bottom of the Bollinger bands. This rally has room to run.
Chart Pattern: None.
Volume: Higher on the rally than the decline, but below average.
Candlestick: A small red candle with a slightly longer upper wick than a lower wick. It still closed above the low of the previous day.
Support: $37
Resistance: $42
Risk-reward: 3 to 1, risking 1 to make 3.
My Plan: I will consider adding more on a pullback and bounce off support.

NIO Weekly Chart
NIO Inc. NIO 0.00%↑
Closing Price: $4.63
Momentum: Turned positive and is making higher highs on B-Xtrender and higher lows on the MACD.
Overbought/Oversold: NIO is still oversold, RSI is 46 and is also near the middle of the Bollinger bands. This rally has room to run.
Chart Pattern: NIO is in a bullish falling wedge.
Volume: Not higher on the rally than the decline yet and is below average.
Candlestick: A bullish engulfing candle, closing closer to the high of the week than the low of the week.
Support: $4.30
Resistance: $5.20
Risk-reward: 1.5 to 1, risking 1 to make 1.5.
Skin in the game (full disclosure): I don’t own any positions.

NIO Daily Chart
Closing Price: $4.63
Momentum: Momentum is positive and is making higher highs on B-Xtrender and on the MACD.
Overbought/Oversold: NEM is still oversold, RSI is 50 and is also near the middle of the Bollinger bands. This rally has room to run.
Chart Pattern: NIO is forming two bullish patterns, an inverted head and shoulders pattern, and a triple bottom.
Volume: Volume is higher on the rally than on the decline and is above average.
Candlestick: NIO formed a medium-sized green candle, closing near the high of the week.
Support: $4.35
Resistance: $5.10
Risk-reward: 1 to 1, risking 1 to make 1.
My Plan: I plan to look for an opportunity for a bullish trade this week.

TAN Weekly Chart
Invesco Solar ETF TAN 0.00%↑
Closing Price: $35.55
Momentum: Turned positive and is making higher highs on B-Xtrender and higher lows on the MACD.
Overbought/Oversold: TAN is still oversold, RSI is 41 and is also near the bottom of the Bollinger bands. This rally has room to run.
Chart Pattern: TAN is in a bullish falling wedge.
Volume: Volume is not higher on the rally than the decline yet and is below average.
Candlestick: A long green candle, closing near the week’s high.
Support: $33
Resistance: $40
Risk-reward: 5 to 2, risking 2 to make 5.
Skin in the game (full disclosure): I have a bullish TAN trade.

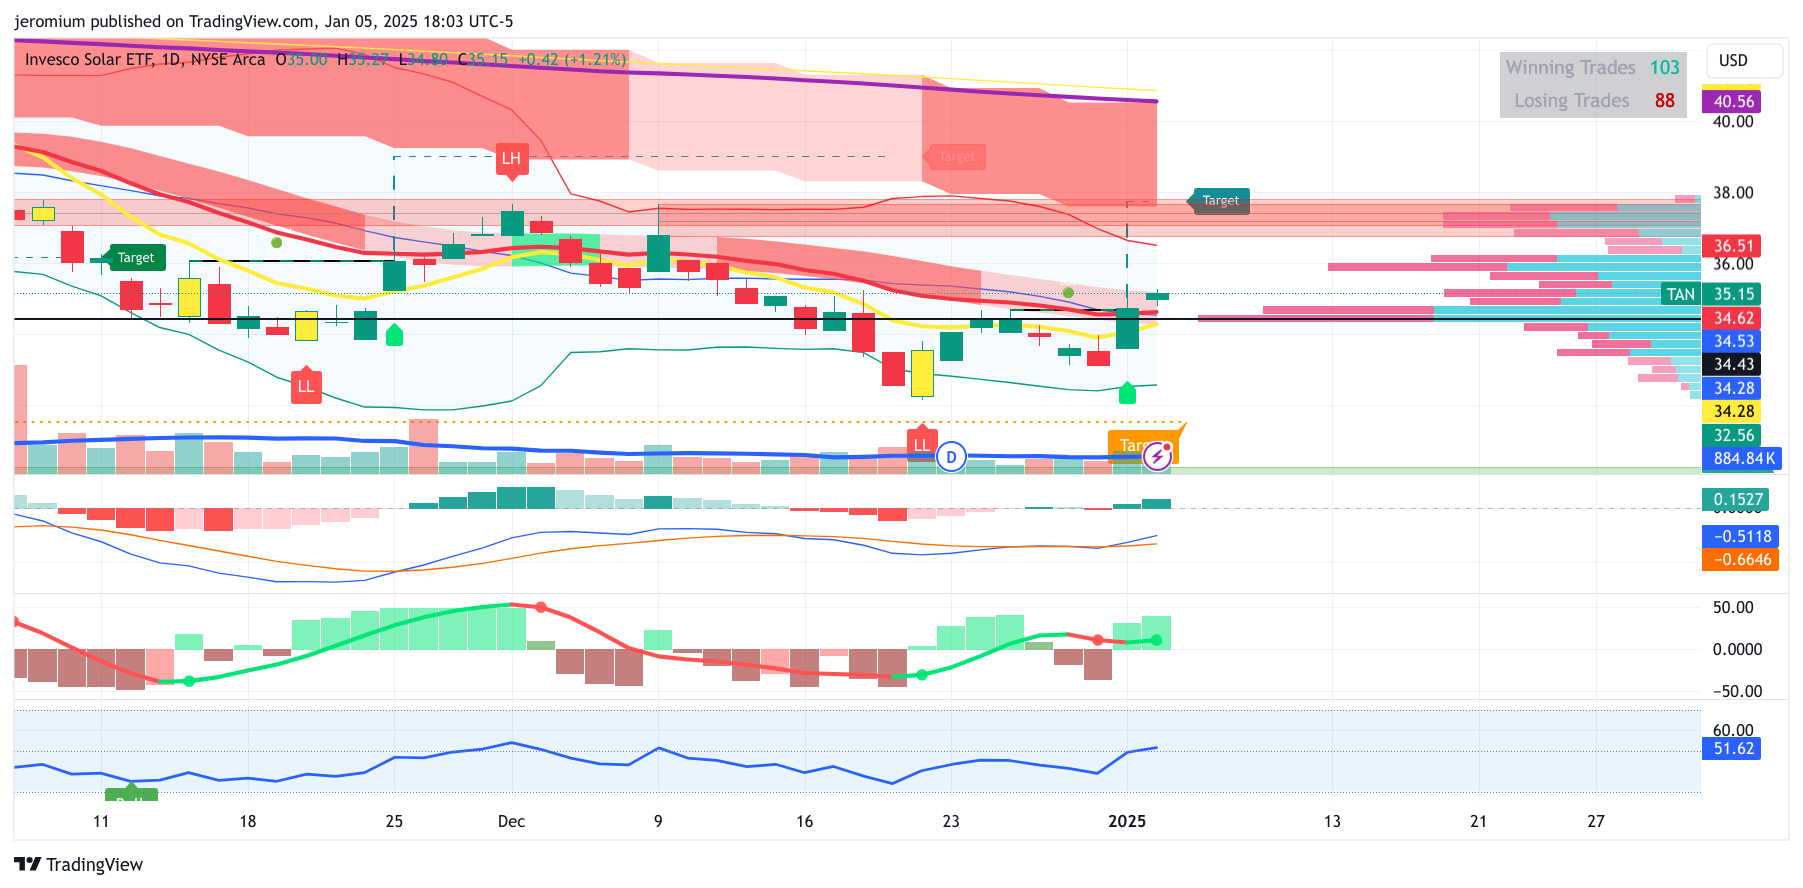
TAN Daily Chart
Closing Price: $35.55
Momentum: Momentum is positive and is making higher highs on B-Xtrender and the MACD.
Overbought/Oversold: TAN is still oversold, RSI is 51, and is closer to the top of the Bollinger bands. This rally has room to run.
Chart Pattern: None.
Volume: Volume is higher on the rally than the decline yet and is about average.
Candlestick: TAN gapped up on Friday and had a small green candle, closing near the week’s high.
Support: $33
Resistance: $37
Risk-reward: 1 to 1, risking 1 to make 1.
UBER Weekly Chart
Uber Technologies UBER 0.00%↑
Closing Price: $64.59.
Momentum: Turned positive and is making higher highs on B-Xtrender and higher lows on the MACD.
Overbought/Oversold: UBER is still oversold, RSI is 44, and is also near the bottom of the Bollinger bands. This rally has room to run.
Chart Pattern: UBER is in a bearish falling wedge. However, it’s near the bottom of the range and moving higher. It will likely take months to break down from here.
Volume: Volume is not higher on the rally than the decline yet and is below average.
Candlestick: A long green candle closing near the week’s high.
Support: $60
Resistance: $71
Risk-reward: 2 to 1, risking 1 to make 2.
Skin in the game (full disclosure): I don’t own any positions.

UBER Daily Chart
Closing Price: $64.59.
Momentum: Momentum is positive and is making higher highs on B-Xtrender and the MACD. RSI is also increasing rapidly.
Overbought/Oversold: UBER is still oversold, RSI is 50, and is also near the top of the Bollinger bands. This rally still has room to run.
Chart Pattern: None.
Volume: Volume is increasing on the up days and is now above average.
Candlestick: A medium-sized green candle closing closer to the week’s high than the low.
Support: $59
Resistance: $71
Risk-reward: 1.5 to 1, risking 1 to make 1.5.
My Plan: I’m waiting for a pullback to support the daily chart. But I may open an iron condor with a bullish bias, giving me time to be right and benefiting from time decay.

Are These Stocks On Your Watch List?
Although these stocks look like they are close to a rally, the stock market is volatile right now.
Most stocks that I’ve looked at lately are likely to decline and they could be a tailwind for all stocks.
Be careful, do only what you understand, and invest only what you can afford to lose.
Disclaimer
This is meant for educational purposes only. It’s not financial advice. Please do your own due diligence. I’m not a financial advisor and can’t give you financial advice.
Trading is risky. Even if you know what you’re doing, you can still lose money. My returns are not typical, and there is no guarantee that you will be able to replicate them.
CFTC RULE 4.41 - Hypothetical or simulated performance results have certain limitations. Unlike an actual performance record, simulated results do not represent actual trading. Also, since the trades have not been executed, the results may have under-or-over compensated for the impact, if any, of certain market factors, such as lack of liquidity. Simulated trading programs in general are also subject to the fact that they are designed with the benefit of hindsight. No representation is being made that any account will or is likely to achieve profit or losses similar to those shown.
Read the full disclaimer here.
My Favorite Trade Idea For Next Week and My Unique Research
Below you will see a sneak peek into my research you won’t find anywhere else. Plus a trade idea with about an 89.5% chance of winning.
This trade setup doesn’t happen often, but it offers an edge when it does, it rewards those who catch it.
Keep reading with a 7-day free trial
Subscribe to Ageless Investing to keep reading this post and get 7 days of free access to the full post archives.