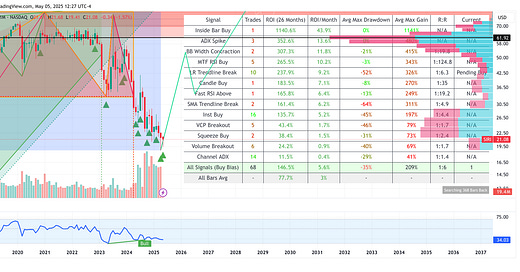
I use my custom indicators to find and evaluate signals along with technical and fundamental analysis to maximize opportunities and reduce false signals.
This isn’t financial advice, Please read my disclaimer at the end.
Caution: The stock market is volatile. These signals are best for long-term buy and hold.
SIRI
SIRI 0.00%↑ is showing signs of reversing on the monthly, weekly, and daily charts.
Stop loss: $19
Monthly Chart
A series of long lower wicks and shrinking candles could imply a reversal.
Weekly Chart
SIRI is in a bullish falling wedge and nearing a breakout point. Meanwhile, the RSI is slowly rising.
Daily Chart
SIRI made a higher low on the price and RSI. It’s still close to support, with a decent risk-reward.
1 Hour Chart
SIRI is at the downward trendline resistance, and the candle bodies are shrinking. Will it break out or break down? I’d wait for either a pullback to support or a breakout on strong volume.
Keep reading with a 7-day free trial
Subscribe to Ageless Investing to keep reading this post and get 7 days of free access to the full post archives.


