


The Asymetric Buy Signals Indicator For Swing Trading and Long-Term Invesing
This indicator finds high ROI buy signals and weeds out false signals

There are asymmetric buy signals hidden in plain sight every day. Why can’t we see them?
We’ve been told to chase quick returns and ignore long-term opportunities.
The problem is, by the time you find out about it, you’re buying at a poor risk-reward entry.
I created the Asymmetric Buy Signals Indicator to help me find high-risk-reward buying opportunities before the big move. I’ve tried hundreds of combinations to help eliminate false signals. however, it comes with a trade-off. The more certain, the lower the risk-reward.
Instead of trying to eliminate as many false signals as possible, the indicator allows you to optimize the number of confluences.
Generally, the higher the confluences, the higher the ROI. However, the number is different for every symbol.
The main question is this: Is this a stock or ETF that I want to own long-term? Or, am I willing to risk a tiny amount for months or more for a potentially large ROI?
If the answer is no to both of these, this indicator will not help you.
It won’t predict price moves. However, it can predict the potential long-term ROI.
I’m creating a series of indicators that will work in synergy. They will show me what’s in an optimal environment to buy or sell and signal the most optimal entry.
The first indicator in this series shows the ideal RSI range for buying or selling. This works with this one to help with optimizing the settings and quickly screening your watch list for potential opportunities
Learn how to get it or try it out at the end of the post.

Disclaimer
This is meant for educational purposes only. It’s not financial advice. Please do your own due diligence.
Investing in stocks and options is risky and not suitable for everyone. You are responsible for your losses and profits.
I’m not a financial advisor and can’t give you financial advice. Read the full disclaimer here.
Asymmetric Buy Signals (Swing Trading/Long-term investing)
The "Asymmetric Buy Signals" is a non-repainting TradingView indicator designed to identify high-probability buy opportunities with asymmetric risk-reward potential.
Non-repainting means the signals form at the bar’s close (for example 1 day on the daily chart), and don’t change, allowing for backtesting consistency.
It combines 9 independent buy signals with a confluence system of 11 components, plotting buy signals as green triangles below price bars.
Support zones are visualized as green boxes, and a performance metrics table provides historical insights.
Key Features:
Confluence System: Uses 11 signal types, requiring a minimum (default 3) to trigger a buy when confluence is enabled. You also have the option to increase or decrease to find the optimal range for a good amount of quality buy signals.
Multi-Timeframe RSI: Integrates RSI across fast (e.g., daily), slow (e.g., weekly), and long-term (e.g., monthly) timeframes.
Signal Types: Includes RSI thresholds, trendline breakouts, candlestick patterns, low offset from 52-week lows, and multi-timeframe RSI swing conditions.
Confluence-Only Signals: RSI Divergence and Support Proximity enhance signal strength without triggering buys independently.
Support Zones: Displays daily, weekly, and monthly support levels.
Performance Metrics: Shows total signals, their average ROI for the selected range, max gain, drawdown, risk-reward ratio, and 1-year ROI.
How to Use It

Request access because it is an invite-only. Next, In TradingView, go to the chart, click "Indicators," open invite-only, search for "Asymmetric Buy Signals (Swing Trading/Long-term investing)," and add it.
Direct message me your TV username for a free trial or become a paid member to keep your access.
Search for it in the Invite-only tab under indicators.
Ensure at least 260 bars of historical data
Configuration:
Confluence Settings:
useSignalConfluence (default: true): Enable/disable confluence filter.
minSignalTypes (default: 3): Minimum signals required for a buy.
confluenceLookback (default: 15): Lookback period for confluence.
RSI Settings: Adjust timeframes and thresholds (e.g., fastRSIThreshold = 30).
Optional Filters: Toggle requireRisingSMA, requireSlowRSI, or requireSlowestRSI.
Support Zones: Enable showDailySupport, showWeeklySupport, showMonthlySupport.
Table Metrics: Customize via showBuyAvgROI, showRiskReward, etc.
Interpreting Signals:
Buy Signals: Green triangles appear below bars. With confluence on, at least 3 of 11 signals must be active; with it off, any of the 9 independent signals suffice.
Support Zones: Green boxes indicate support levels for context (not buy triggers).
Table: View stats like Avg ROI and Risk-Reward on the chart’s right side.
Trading Application:
Short-Term: Set minSignalTypes to 1-2 and use shorter timeframes (e.g., 1h).
Long-Term: Increase minSignalTypes to 4-5 or enable requireSlowestRSI.
Confirmation: Pair with volume or price patterns for added confidence.
Limitations
Data Dependency: Needs sufficient history; missing data (e.g., monthly RSI) may limit functionality.
No Sell Signals: Focuses only on entries, lacking exit or stop-loss guidance.
Confluence Trade-Off: High minSignalTypes reduces signal frequency, potentially missing trades.
Fallback Bias: Defaulting to lowest RSI bars may skew results if not strategic.
Asset Variability: Effectiveness varies by market and timeframe; requires tuning.
Not suited for day trading or short-term trading.
Over-Optimization Risk: Extensive settings may lead to overfitting if backtested excessively.
Financial Disclaimer
This indicator is for educational purposes only and is not financial advice. Trading carries a high risk of loss, and past performance does not guarantee future results. Users should perform their own analysis, consult a financial advisor, and assess their risk tolerance. The creators are not responsible for any losses incurred.
Backtesting and Predictive Limitations
Backtesting offers historical insights (e.g., ROI, drawdown) but cannot predict future outcomes. Markets shift due to external factors (e.g., news, economics) not captured here. Historical success may not repeat, and backtesting assumes static conditions. Use it as a tool for understanding, not a crystal ball, and confirm signals in real-time
Examples
Default Setting Example: TSLA
The default setting shows all signals with some filtering for false signals that can be adjusted.
Current Signal: Indicates whether a buy signal is currently active ("Pending Buy Signal" in green) or not ("Not a Buy" in red).
Total Buy Signals: Shows the total number of buy signals generated historically, with "(Fallback)" appended if the fallback mechanism was triggered.
Signals Last Year (260 Bars): Displays the count of buy signals within the last 260 bars, approximating a year’s worth of data.
Avg ROI (20 Bars): Reports the average return on investment percentage over the specified roiBarsForward period (default 20 bars) for all buy signals, colored green if positive, red if negative.
Avg Max (20 Bars): Presents the average maximum gain percentage achieved within roiBarsForward (default 20 bars) across all buy signals, or "N/A" if no trades.
Avg Drawdown (20 Bars): Shows the average maximum loss percentage within roiBarsForward (default 20 bars) for all buy signals, in red, or "N/A" if no trades.
Max Drawdown (20 Bars): Indicates the largest single drawdown percentage observed within roiBarsForward (default 20 bars) across all signals, in red, or "N/A" if no trades.
Avg ROI per Bar (20 Bars): Calculates the average ROI per bar over roiBarsForward (default 20 bars), colored green if positive, red if negative.
Risk-Reward Ratio (20 Bars): Displays the ratio of average maximum gain to average drawdown within roiBarsForward (default 20 bars) as "1:X.X", or "N/A" if no trades or zero drawdown.
Avg ROI (1 Year, 260 Bars): Shows the average ROI percentage over 260 bars (1 year) for all buy signals, colored green if positive, red if negative, or "N/A" if no yearly trades.
Examples of Pros
TSLA 0.00%↑ default settings

Although TSLA works perfectly, I recommend using the confluence optimizer for each symbol. Generally, the higher the number, the better the quality signal. However, the optimal number is different for every symbol. It’s also difficult to default to the optimal setting as it could only have a small sample.
Manually adjusting allows you to find the sweet spot between average ROI and enough signals.
The default confluence filter is 3, but the ideal setting appears to be 6 for TSLA.


Notice how the average ROI increased to 16.3%, or about .8% per day, and the 1 year ROI increased to 134.2%. The trade-off is, that you may only get one trade a year, compared to 11 with the default settings.
This is why I have a large watch list.
AAPL
Default settings, rare, high-quality signals.

Bitcoin

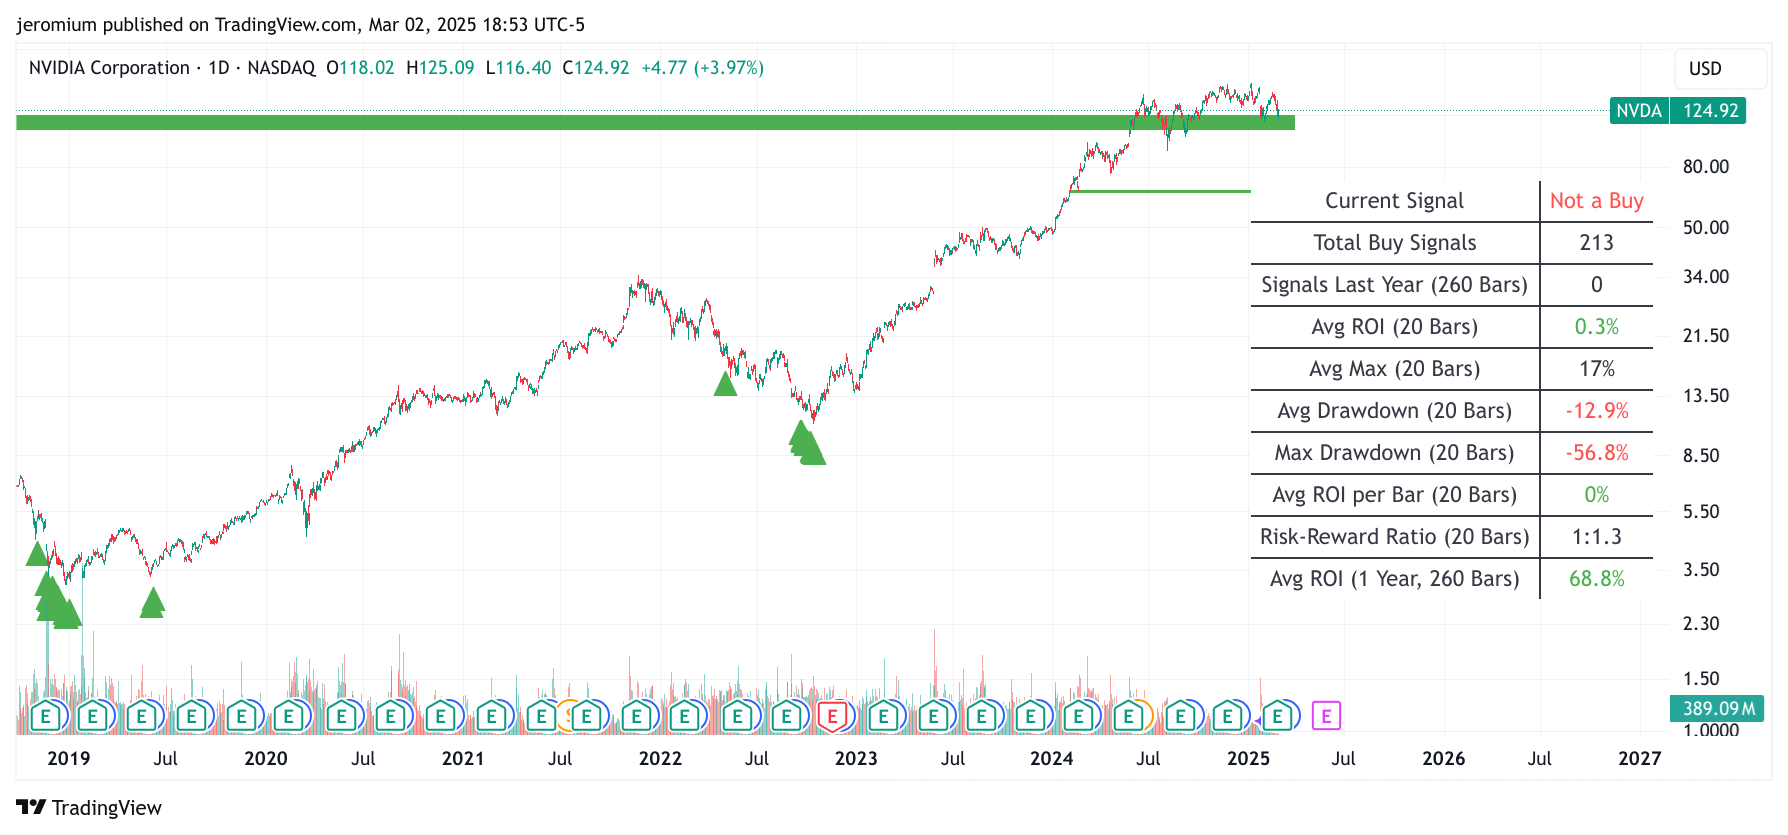
Long-term Buy the Dip: NVDA
NVDA had a good long-term buy signal when the split-adjusted price was $11.
Long-Term Buy Setting
Here’s the default setting for GDX

Here’s The Long-term setting for deep value
I selected the long-term buy signals which are the best for swing trading and long-term buy and hold. however, the trade-off is the signals are rare. I recommend scanning a large watch list frequently for these rate asymmetric buy signals like 51.8% in one year on average

That doesn’t mean that these signals will keep outperforming. but it’s a good place to start to find hidden buy signals the market underestimates.
Examples: Of Cons
Sometimes it signals to buy while momentum is still negative and the price is collapsing.

CELH
Although the long-term numbers may look good, you would’ve had severe losses over the last year.
It’s hard for this indicator to look at the bigger picture and see that CELH was overvalued for years, not just months.

Support Zones Examples: TDW
I added monthly, weekly, and daily support zones to give a broader view of long-term opportunities.
There’s nothing wrong with waiting for a buy signal near support.
You don’t have to predict with this indicator. What would you guess is the upside versus the downside?
Because I know this is a good company, I can risk a small amount waiting for the value to be realized knowing it has multiple confluences.

How To Get It
If you are a free subscriber and want a free trial, message me your Tradingview username and I will grant access for a week.
If you are a current paid subscriber, please message me with your Tradingview username and I will grant you access. However, you may lose access if you cancel your membership.
Once you’ve paid $50 in total or are on the yearly subscription for my Substack, I will grant you lifetime access to all past and future indicators. This amount will increase as I create more indicators.
I will raise my paid subscriber prices before I release my next indicator.
Want a free trial? Subscribe and message me and I will grant you free access for 1 week. (I may end or change this offer at any time).
Up Next: 1% Daily Compounder Indicator
This indicator finds combinations with at least a 1% 1-day ROI potential.
It’s based on 10 years of back-testing 12 combinations (more soon). It shows in a table how well these combinations have worked in the past for the selected symbol. Here’s a preview.
However, that’s just the beginning. I plan to test hundreds of combinations to find enough statistically significant high ROI opportunities almost every day.
To keep the quality improving, prices will have to go up every time I create a new indicator.
Thank you, and please let me know which type of indicators you want to see.