


This Indicator Ranks Indicators and Finds Expected ROI For Each Symbol
This indicator finds the best performing indicators and values for each symbol based on back testing

What’s the best indicator for trading?
RSI, MACD, moving averages, ATR, ADX, volume, Bolinger bands, 52-week highs, and lows, or price change?
Well, this indicator finds the most significant indicators for each symbol.
It also shows the values for each indicator for the best and worst-performing days (or selected timeframe) to see what they have in common.
You can quickly compare the current values to the best and worst days based on the selected lookahead period from 1 day to 1 year later.
Lastly, you can see the correlation weighted expected ROI for the current day (or any time frame).
I’m creating a series of indicators that will work in synergy. They will show me what’s in an optimal environment to buy or sell and signal the most optimal entry.
The first indicator in this series shows the ideal RSI range for buying or selling. This works with this one to help with optimizing the settings and quickly screening your watch list for potential opportunities
The second is the Asymmetric Buy Signals which help you find hidden opportunities.
The indicator selection optimizer will help you confirm buy signals from the other indicators.
Learn how to get it or try it out at the end of the post.


Disclaimer
This is meant for educational purposes only. It’s not financial advice. Please do your own due diligence.
Investing in stocks and options is risky and not suitable for everyone. You are responsible for your losses and profits.
I’m not a financial advisor and can’t give you financial advice. Read the full disclaimer here.
Indicator ROI Optimizer: User Guide
What is the Indicator ROI Optimizer?
The Indicator ROI Optimizer is a custom TradingView indicator designed to analyze historical price data and technical indicators to predict potential future returns on investment (ROI).
It evaluates how various technical indicators correlate with price movements over a specified look-ahead period, providing traders with insights into which conditions historically led to the best and worst returns.
The indicator displays its findings in a detailed table and generates buy signals based on a weighted ROI calculation and a similarity score.
Key Features
Historical ROI Analysis: Calculates ROI over a user-defined forward period (e.g., 20 bars) based on past data.
Indicator Correlation: Assesses how 11 technical indicators (e.g., RSI, ATR, MACD) correlate with ROI.
Top/Worst Performance: Identifies the top and bottom N bars (e.g., 20) based on ROI and shows the average, median, minimum, or maximum values of indicators during those periods.
Buy Signals: Triggers a buy signal when the weighted average ROI exceeds a threshold, plotted as a green triangle below the chart.
Similarity Score: Measures how closely current indicator values match historical top-performing conditions.
Customizable Table: Displays analysis results with options to show/hide columns (e.g., top bars, worst bars, correlations).
This tool is ideal for traders seeking data-driven insights into how technical indicators predict price movements, helping to refine strategies or identify high-probability setups.
How It Works
The Indicator ROI Optimizer operates by analyzing historical data over a specified lookback period (e.g., 500 bars) and calculating the ROI for a forward-looking period (e.g., 20 bars). It then ties this ROI to the values of 11 technical indicators at the entry points, providing a statistical breakdown and real-time signals.
Step-by-Step Process
Data Collection:
The indicator uses a circular buffer to store up to 500 bars (configurable via lookBackBars) of price and indicator data.
For each bar, it records the closing price and values of 11 indicators: RSI, Distance from Moving Average, ATR, VIX, Relative Volume, Bollinger Bands Width, MACD Histogram, ADX, RSI SMA Slope, 1-Day Price Change, and 52-Week Price Range.
ROI Calculation:
For each historical bar, it calculates the ROI by comparing the entry price (close at that bar) to the price lookAheadBars bars later (e.g., 20 bars ahead).
Example: If lookAheadBars = 20, the ROI for bar 100 is (close[80] - close[100]) / close[100] * 100.
Top and Worst N Bars:
Sorts all ROIs and selects the top and bottom N bars (e.g., topN = 20) to analyze.
Computes a statistic (average, median, min, or max, based on statMethod) for each indicator during these top and worst periods.
Correlation Analysis:
Calculates the Pearson correlation coefficient between each indicator’s values and the corresponding ROIs over the lookback period.
A positive correlation means higher indicator values are associated with higher ROIs; a negative correlation suggests the opposite.
Expected ROI:
For each indicator, divides its historical values into quartiles (25th, 50th, and 75th percentiles).
Estimates the expected ROI for the current bar by averaging the ROIs of past bars where the indicator fell into the same quartile as its current value.
Weighted ROI and Buy Signal:
Computes a weighted average ROI by combining each indicator’s expected ROI, weighted by the absolute value of its correlation to ROI.
If this weighted ROI exceeds roiThreshold (e.g., 2.5%), a buy signal is triggered and plotted as a green triangle below the bar.
Similarity Score:
Compares current indicator values to their averages during the top N ROI bars.
If a current value is within tolerance (e.g., 10%) of the top N average, it contributes to the similarity score based on the indicator’s correlation strength.
A score above simThreshold (e.g., 10) triggers an alert (not plotted).
Table Display:
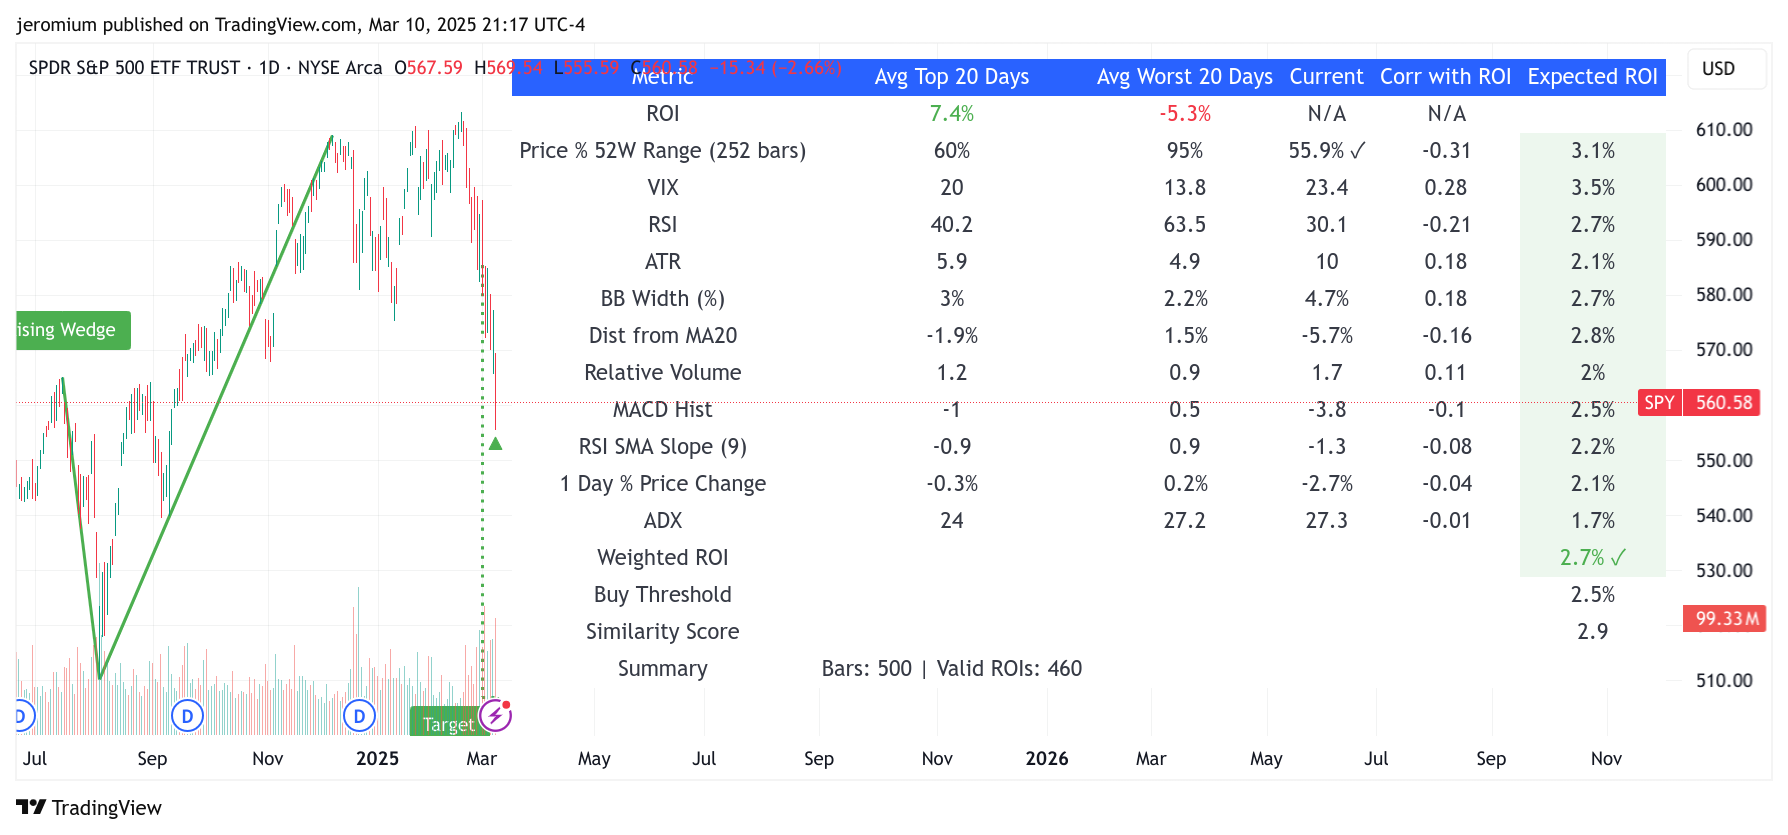
Shows a table with columns for each indicator’s metric name, top N statistic, worst N statistic, current value, correlation with ROI, and expected ROI.
Columns can be toggled via inputs (e.g., showTopBars, showCorr).
Includes summary rows for weighted ROI, buy threshold, similarity score, and a summary of bars analyzed.
Inputs and Customization
Lookback Period (lookBackBars): Number of past bars to analyze (100–2000).
Look-Ahead Period (lookAheadBarsInput): Bars to look forward for ROI (capped by timeframe: 250 daily, 52 weekly, 12 monthly).
Top/Worst Bars (topN): Number of top and bottom ROI bars to analyze (1–50).
Statistic Method (statMethod): Choose Average, Median, Minimum, or Maximum for top/worst bars.
Display Settings: Toggle table visibility, timeframe label detail, and summary row.
Table Columns: Show/hide top bars, worst bars, current values, and correlations.
Signal Settings: Set thresholds for ROI buy signals and similarity score alerts.
Indicator Periods: Customize periods for RSI, ATR, MACD, etc.
Limitations
While the Indicator ROI Optimizer is powerful, it has limitations that users should understand to use it effectively:
Historical Bias:
The indicator relies on past data to predict future performance. If market conditions change (e.g., a shift from trending to ranging), historical patterns may not hold.
Look-Ahead Period Constraint:
The maximum lookAheadBars is capped (e.g., 250 for daily charts), limiting the ability to analyze very long-term ROIs without adjusting the timeframe.
Data Requirements:
Requires sufficient historical bars (at least lookBackBars + lookAheadBars) to function fully. On charts with fewer bars, it displays an "Insufficient data" warning and stops processing.
Correlation Assumptions:
Assumes linear relationships between indicators and ROI. Non-linear relationships or complex interactions between indicators may not be captured.
VIX Availability:
The VIX indicator requires the VIX symbol to be available. On symbols or platforms where it’s not accessible, it defaults to 0, potentially skewing results.
Fixed Indicator Set:
Analyzes a predefined set of 11 indicators without an option to add custom indicators, limiting flexibility for users with unique strategies.
Performance Overhead:
Calculating correlations, sorting ROIs, and updating the table can be computationally intensive, especially with large lookBackBars or frequent updates, potentially slowing down on lower-end devices.
Overfitting Risk:
Optimizing strategies based solely on historical top-performing conditions may lead to overfitting, where the strategy performs well on past data but poorly in real-time trading.
No Risk Adjustment:
ROI calculations don’t account for risk (e.g., drawdowns, volatility), so a high ROI signal might coincide with high risk.
Practical Tips
Start Small: Test with a shorter lookBackBars (e.g., 200) and lookAheadBars (e.g., 10) to understand how it behaves on your symbol and timeframe.
Adjust Thresholds: Tune roiThreshold and simThreshold based on backtesting to balance signal frequency and reliability.
Combine with Other Tools: Use the indicator alongside support/resistance levels, volume analysis, or other confirmations to reduce false signals.
Monitor Similarity: A high similarity score suggests current conditions resemble past winners, but verify with price action before acting.
Test Across Timeframes: Experiment with daily, weekly, or intraday charts to find the best fit for your trading style.
Conclusion
The Indicator ROI Optimizer is a sophisticated tool for traders who want to leverage historical data and technical indicators to inform their decisions.
By highlighting which indicators have predicted strong returns and providing real-time signals, it offers a data-driven edge.
However, its reliance on past performance and fixed methodology means it’s best used as part of a broader strategy, with an awareness of its limitations.

How I Use It
First, I check SPY 0.00%↑ to see the expected return of the S&P 500. Today, it gave a buy signal as the Weighted ROI based on backtesting is above the threshold I chose.
This is significantly above average for SPY for about 1 month.
Next, I screen my watch list with this indicator for ideas. I look for symbols that have at least a 5% expected ROI over the next 20 trading days.

I make a list of stocks to check further.
I look for chart patterns, support, momentum, and trend reversals.
NVDA 0.00%↑ still has negative momentum, however, over many trades, the expected ROI should beat the market.
I set the look ahead to 200 trading days and the historical return based on similar scenarios returned 157.2% compared to only 1.9% for $TSLA. *The top 30 days should say 200. This is still in BETA mode.

Keep in mind that overvalued stocks will project better future returns. However, I’m constantly working on how to balance this. For example, I consider measures of overvaluation such as the range between the 52-week high and low, RSI, and distance from the moving average (length based on the lookahead period).
The best practice would be to confirm on higher and lower time frames as best as you can. You can do this by changing to weeks months, hours, or minutes.
Because of the risk in the market, I only bought a small amount of shares. This is a numbers game. Many small trades with a potentially high ROI should outperform over the long run.
How To Get It
If you are a free subscriber and want a free trial, message me your Tradingview username and I will grant access for a week.
If you are a current paid subscriber, please message me with your Tradingview username and I will grant you access. However, you may lose access if you cancel your membership.
Once you’ve paid $50 in total or are on the yearly subscription for my Substack, I will grant you lifetime access to all past and future indicators. This amount will increase as I create more indicators.
I will raise my paid subscriber prices before I release my next indicator.
Want a free trial? Subscribe and message me and I will grant you free access for 1 week. (I may end or change this offer at any time).
Up Next: Indicators Optimized For Specific Symbols
The first will be optimized for SPY, helping you quickly understand the market trend and, whether it’s overbought or oversold, and the expected ROI based on 10 years of historical data.
I will also give buy and sell signals based on combinations of indicators that have outperformed consistently.
This will help you choose what to trade and when. For example, a high BETA stock should outperform when SPY is undervalued and momentum is starting to increase.
While a low BETA stock will help you lose less in a market decline when the market is overvalued and momentum is slowing.
Thank you, and please let me know which type of indicators you want to see.